bullet_chart_vline
bullet_chart_vline.Rdcreate bullet chart showing last year's value as the target
bullet_chart_vline(file_name = NULL, sheet_name = "Sheet1",
  dataframe = NULL, indicator_name = "indicator_name",
  actual = "actual", actual_lastweek = "actual_lastweek",
  actual_lastyear = "actual_lastyear", target = "target",
  for_year = year(Sys.Date()), cal_type = "fis",
  chart_type = "static", small = FALSE, legend = TRUE,
  remove_no_targets = FALSE, show_text = FALSE)
Arguments
| file_name | path of Excel file |
|---|---|
| sheet_name | specify which sheet in Excel file, Default: "Sheet1" |
| dataframe | specify R dataframe input |
| indicator_name | specify the name of the column that has your indicator/KPI names |
| actual | specify the name of the column that has the current value of your indicators/KPIs |
| actual_lastweek | specify the name of the column that has the indicator/KPI value from the previous week |
| actual_lastyear | specify the name of the column that has the indicator/KPI value from the previous year |
| target | specify the name of the column that has the target value for the indicator/KPI |
| for_year | specify the year in which the report is being made, Default: year(Sys.Date()) |
| cal_type | define what calendar you are using. Options are "fis" for fiscal year starting October 1st, "cal" for calendar year starting January 1st, or enter your own custom date in the format "YYYY/MM/DD", Default: fis |
| chart_type | static of interactive (ggiraph) version |
| small | specify whether you want the small version of the plot (TRUE or FALSE), Default: FALSE |
| legend | specify whether you want to show the legend, Default: TRUE |
| remove_no_targets | remove indicators with Targets == NA or 0, Default: FALSE |
| show_text | Show 'Last Week' & 'Last Year' text, when `small = TRUE` or `chart_type = "interactive"` then no text will be shown by default. |
Details
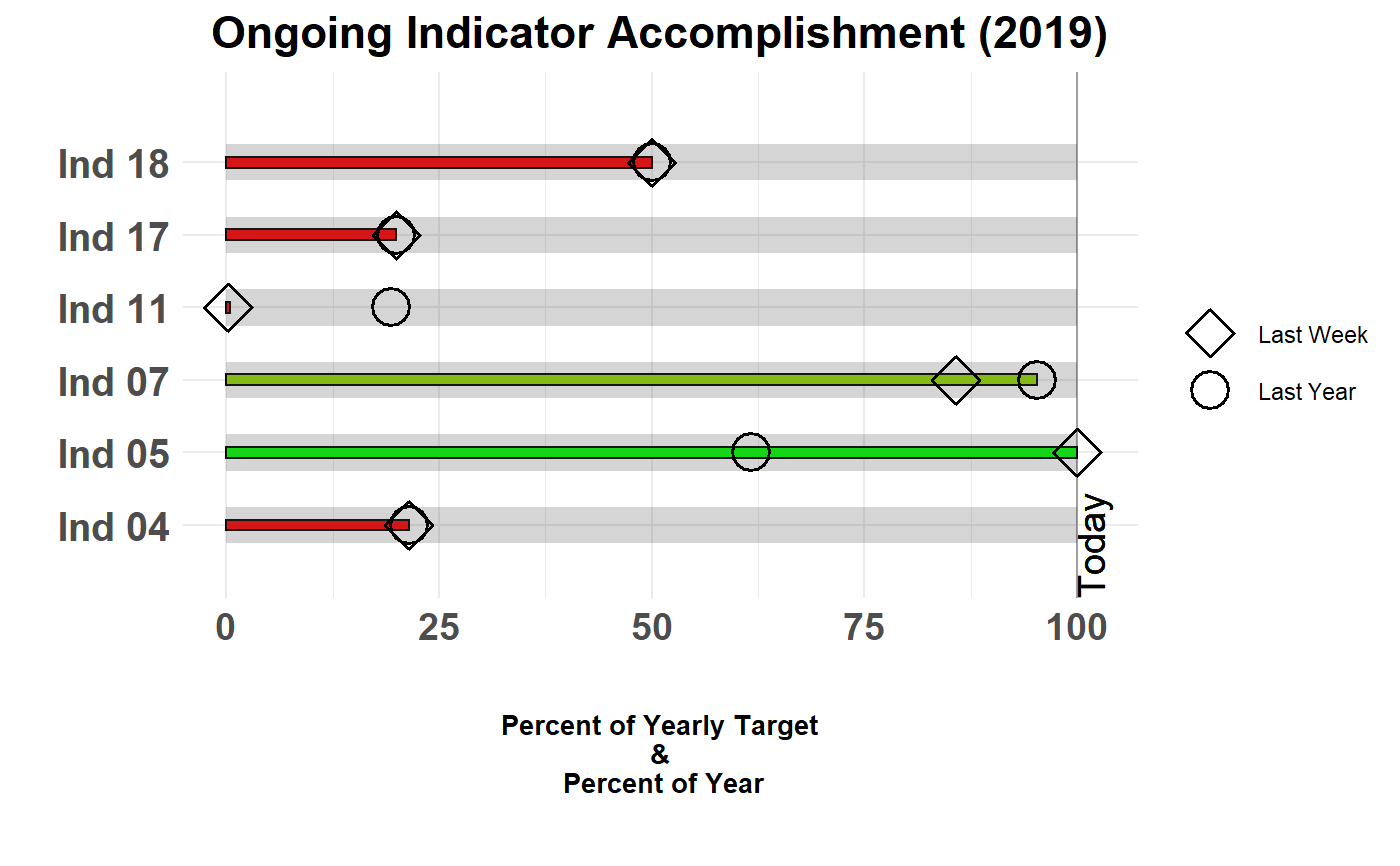
This version of the bullet chart shows a single colored bar representing the current value for the indicator along with a black vertical line representing the indicator value at this time last year. The definition for the vertical line can be changed to your preference (such as a more general "target" value), however at the current time you should change the values of "actual_lastyear" in the Excel file but not the variable name itself.