bulletchartr function arguments
intro-arguments.RmdFunction arguments
Different calendars
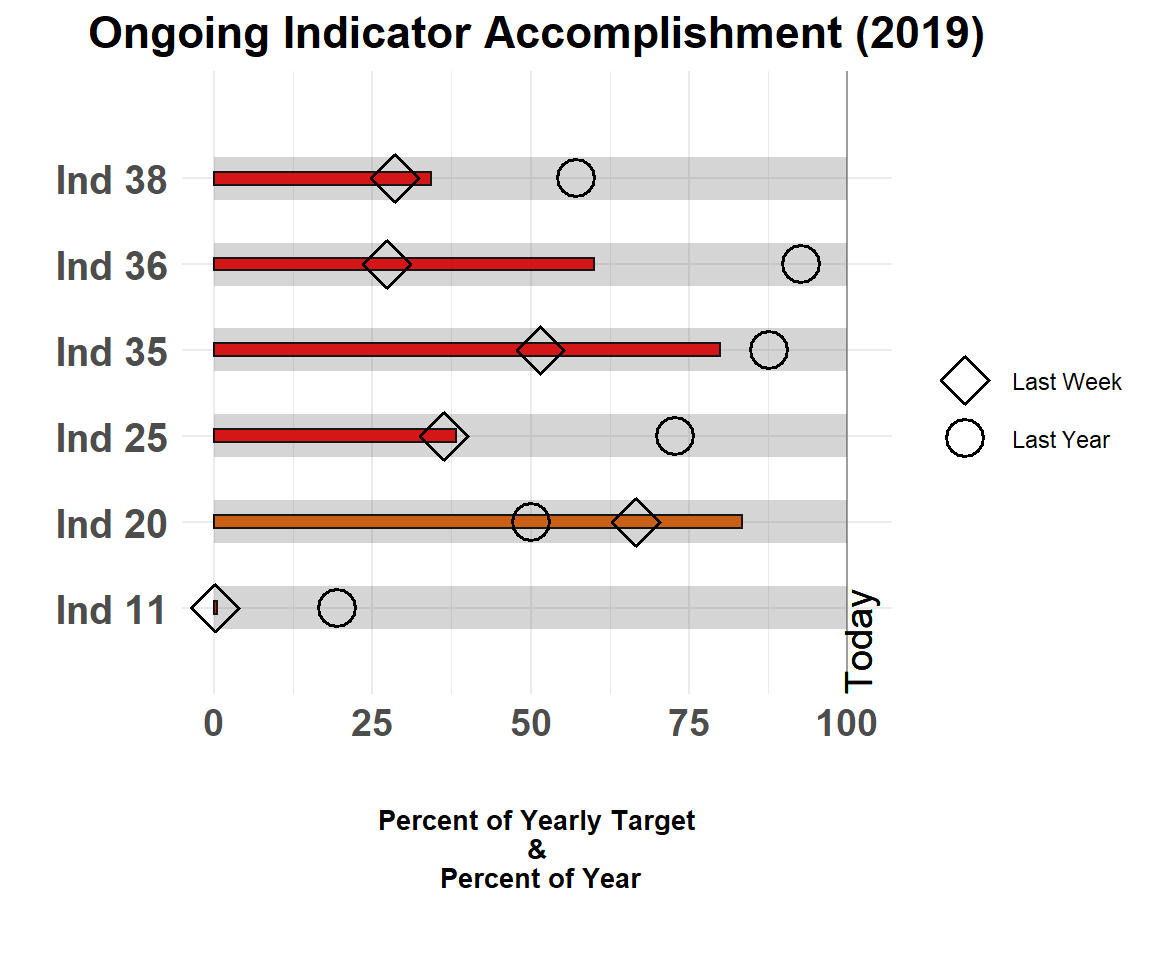
The vertical line showing Today can be customized depending on whether you are measuring by a fiscal year, a calendar year, or a custom date. Today shown on a Fiscal Year calendar (considering that today’s physical date is 2019-11-01.) is show below:
or for a calendar year:
bullet_chart_wide(file_name = read_example("Indicators_Targets_ext.xlsx"),
                     cal_type = "cal",
                  legend = TRUE)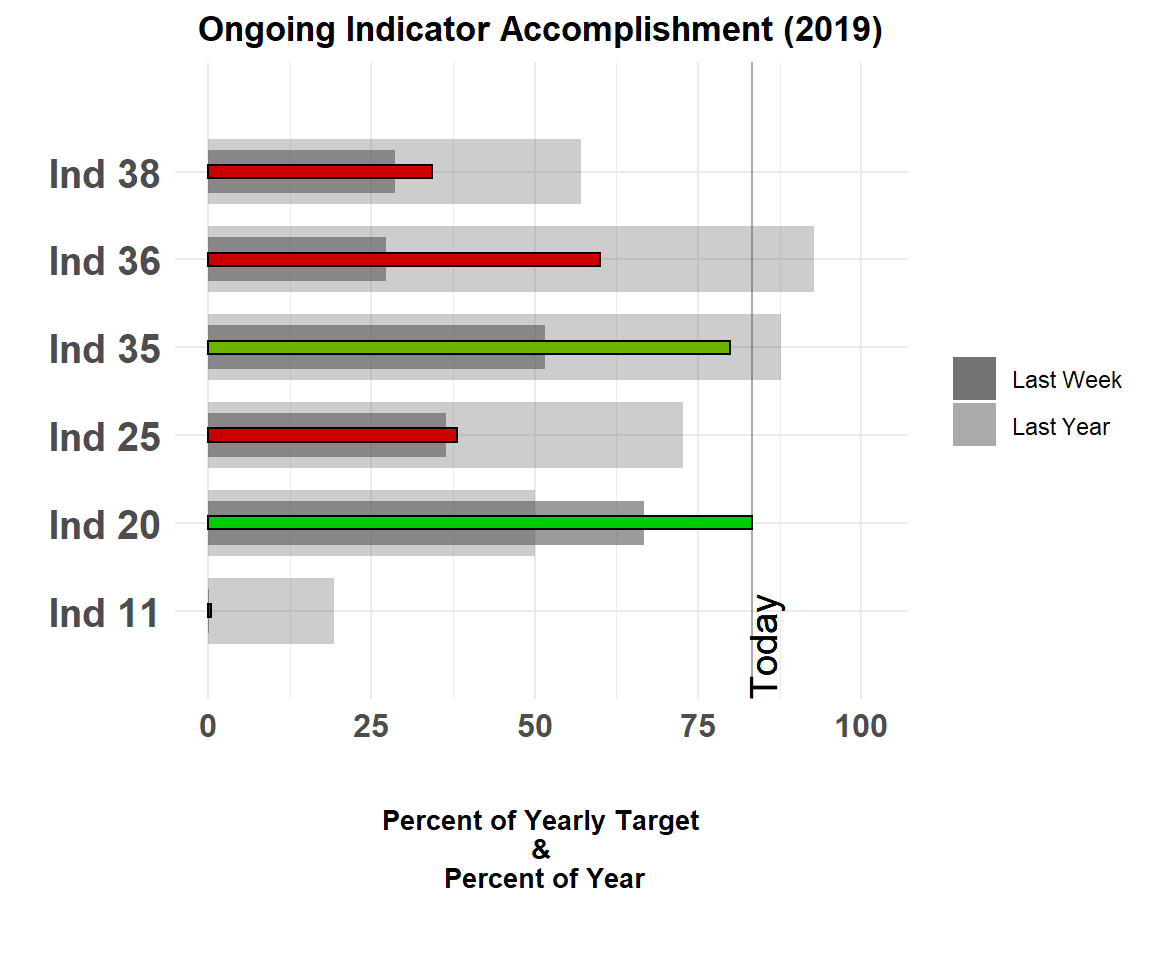
or using a custom date that you can feed directly into the plotting function:
bullet_chart_symbols(file_name = read_example("Indicators_Targets_ext.xlsx"),
                     cal_type = "2019/02/15")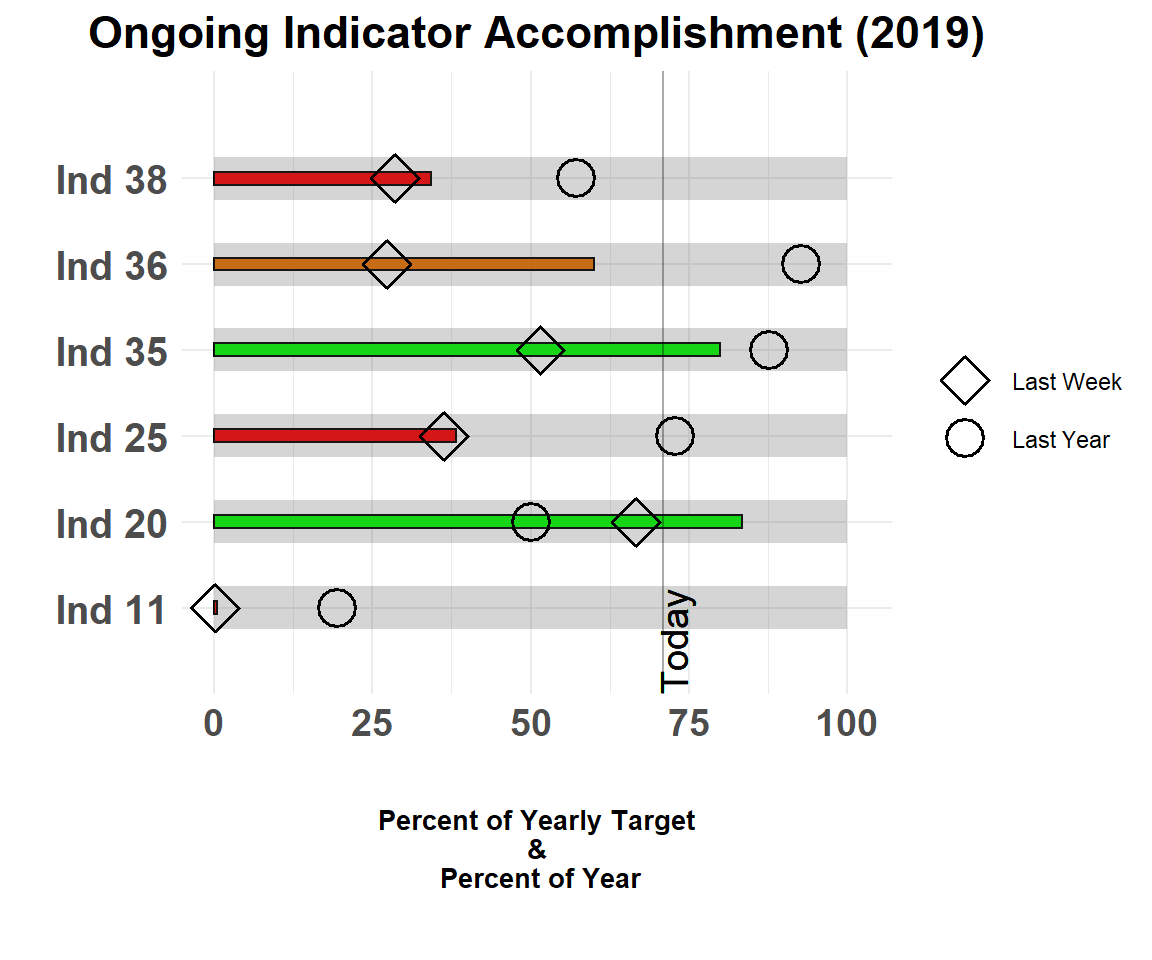
By doing this the function will automatically calculate your progress and targets according to the calendar type that you specified.
small version
If you want to see a small version of your “Plot” panel just specify small = TRUE. This will allow you to quickly check the entire plot without having to enlarge it over and over again in the pop-up window. The small version also hides the text so as to not clutter up the limited space.
Do note that by default the informational text will not show up by default when small = TRUE even when you set the argument show_text to TRUE, you will get a short warning when you do.
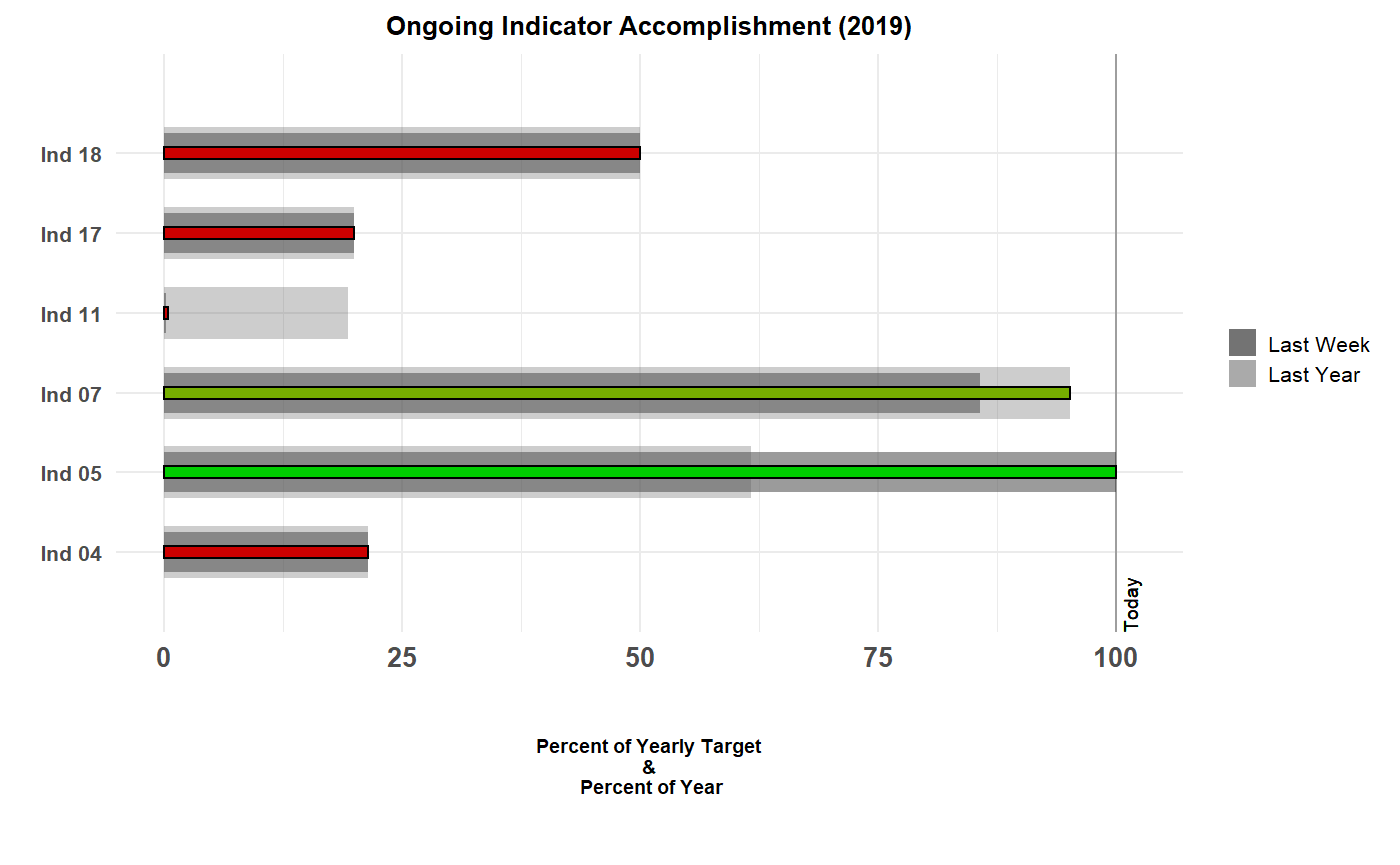
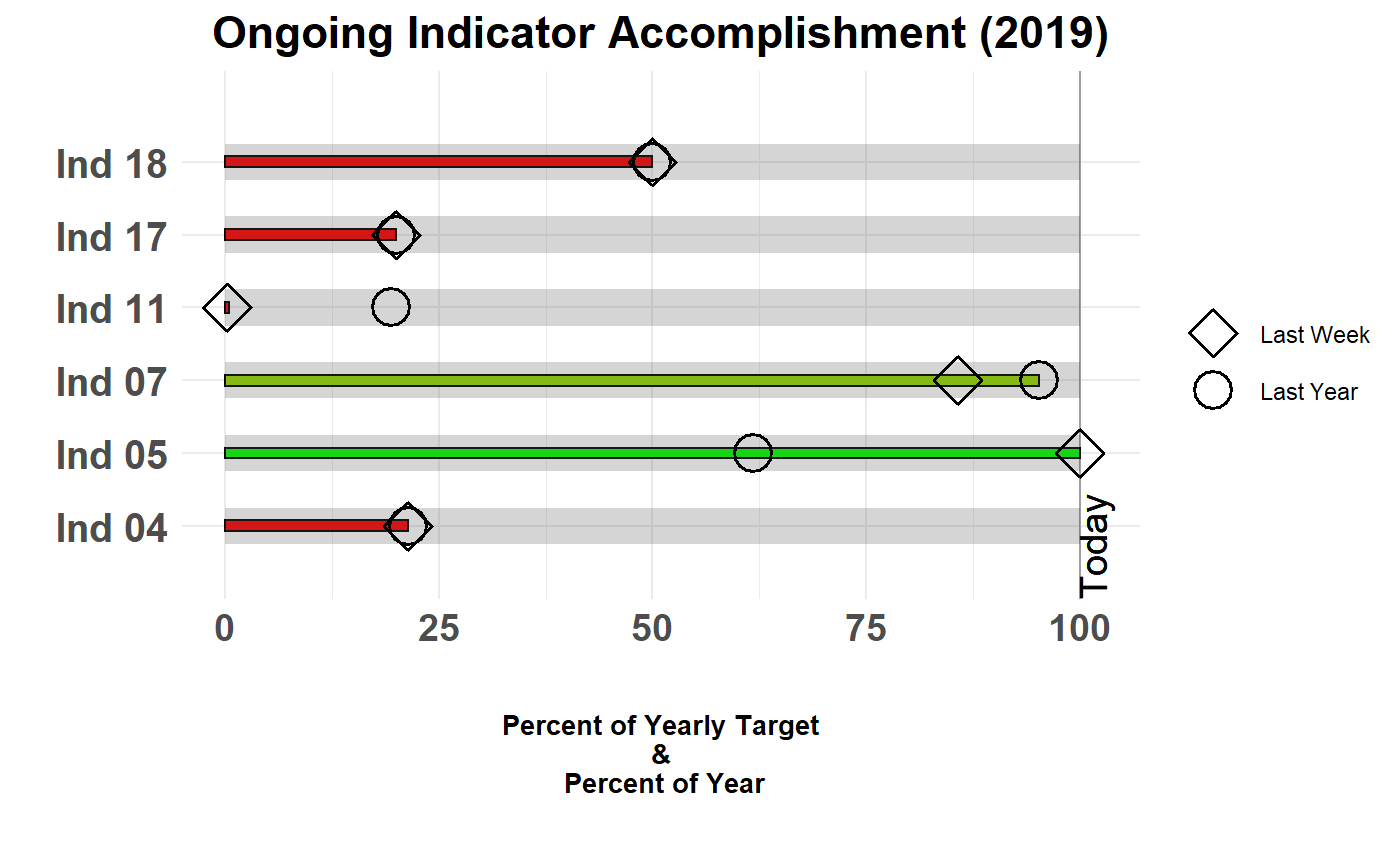
Show legends
You have the option to show legends for both the indicator schedule and the symbols by specifying legend = TRUE. Default is FALSE.
Show Last Week & Last Year info text
bullet_chart_symbols(file_name = read_example("Indicators_Targets.xlsx"),
                     legend = TRUE,
                     show_text = TRUE)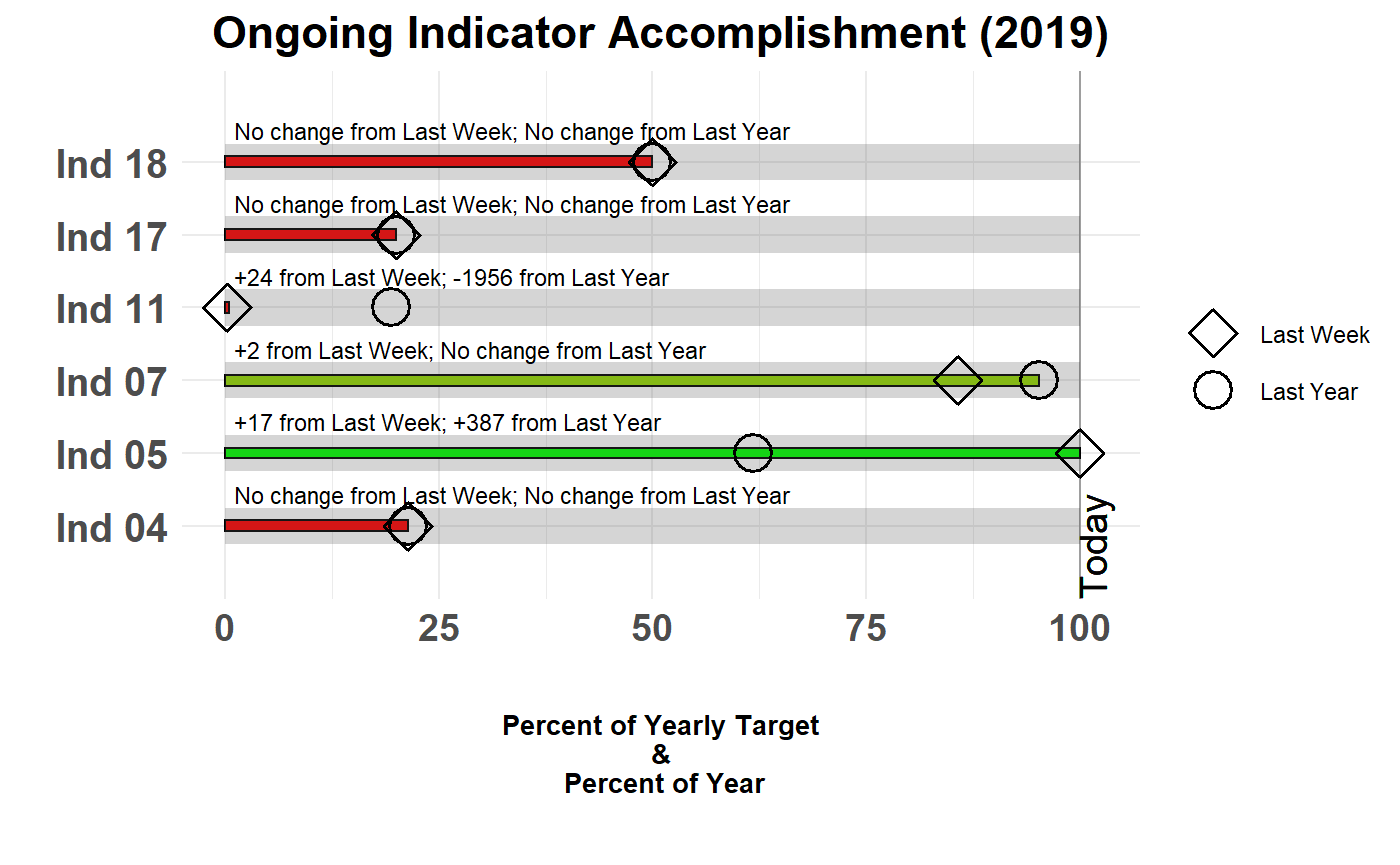
Chart type: Static vs. Interactive
An interactive version where you can hover your mouse over the bar to see the informational text is available with the chart_type argument. This is because the show_text option can make the chart look rather busy at times. The interactivity is handled by the {ggiraph} package.