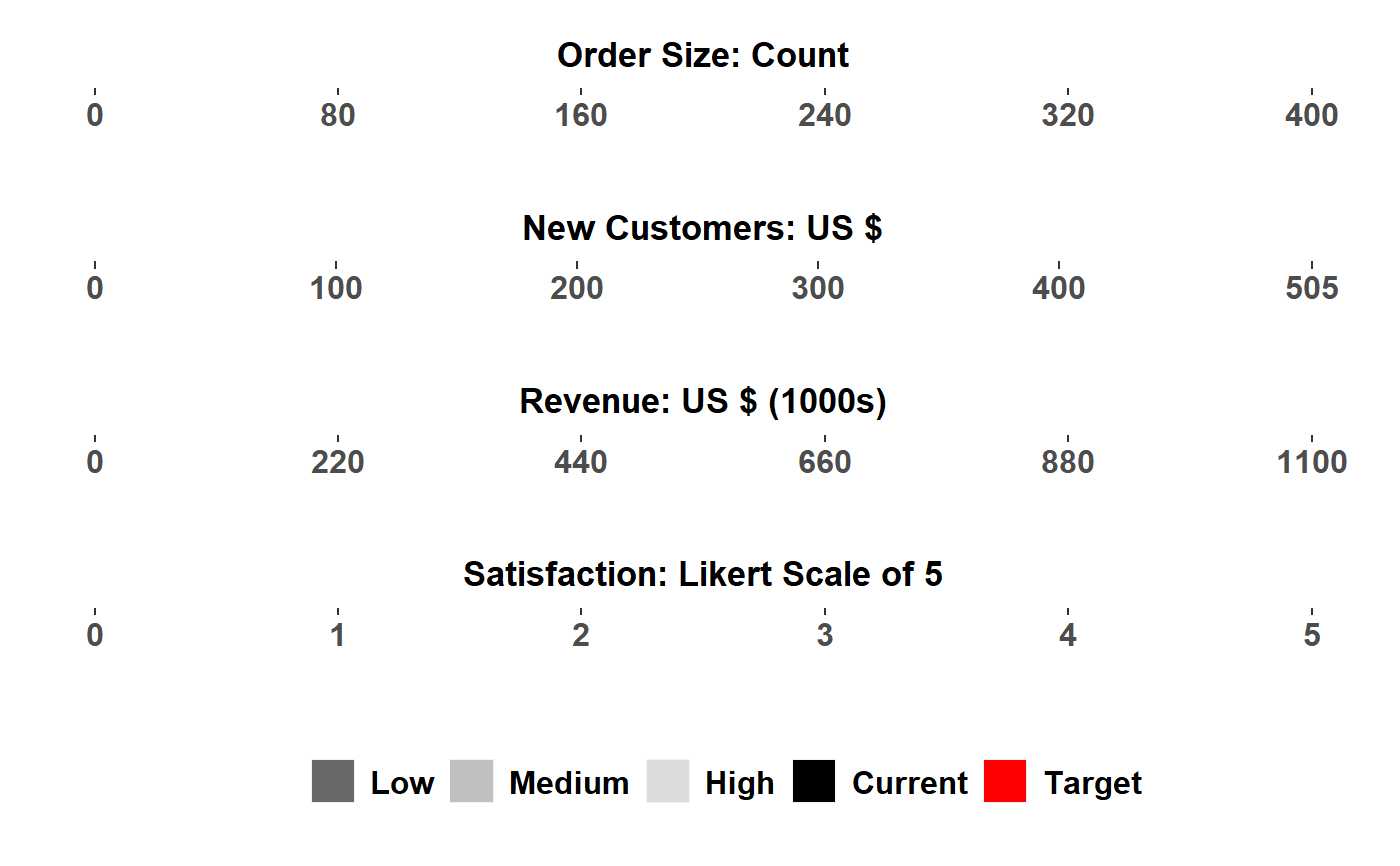
'Stephen Few'-style Bullet Chart
bullet_chart.RdCreates a bullet chart using an indicator's values for the axis scales.
bullet_chart(file_name = NULL, sheet_name = "Sheet1",
  dataframe = NULL, indicator_name = "variable", info = "info",
  current = "current", low = "low", medium = "medium",
  high = "high", target = "target", remove_no_targets = TRUE,
  legend = TRUE)
Arguments
| file_name | path of Excel file |
|---|---|
| sheet_name | specify which sheet in Excel file, Default: "Sheet1" |
| dataframe | specify R dataframe input |
| indicator_name | specify the name of the column that has your indicator/KPI names, Default: 'variable' |
| info | extra info for indicators (currency, percentage, symbol, etc.) |
| current | current value of indicator |
| low | column with value for "low" |
| medium | column with value for "medium" |
| high | column with value for "high" |
| target | column with value for the "target" |
| remove_no_targets | Removes indicators without a "target" value specified, default: TRUE |
| legend | Show legend, Default: TRUE |
Value
bullet chart plot(s)
Details
Stephen Few style bullet chart